Quote displays data of Stock and Fund instrument. From this menu, you can view data of stock/fund instrument by typing symbol in the symbol entry box  and press Enter or click  , e.g. STB and ACB.
 Simple Quote Simple Quote
Displays price data.
| Field |
Description |
| Name |
Company name |
| Symbol |
Instrument symbol |
| Last |
The most recent trade price |
| Change |
The difference between last and previous close (reference price) |
| %Chg |
The difference between last and previous close (reference price) in percentage |
| Open |
The opening price |
| High |
The highest price of the day |
| Low |
The lowest price of the day. |
| Ref |
The reference price or previous close. For HASTC market, reference price is the average price of the last trading day |
| Ceil |
Ceiling price |
| Flr |
Floor price |
| Vol |
Accumulated trading volume of the day |
| Value |
Accumulated trading value of the day. Display in 1000 VND |
| Exch |
Stock exchange which instruments are traded |
| Field |
Color |
Description |
| Last, Change, %Chg |
Green
Yellow
Red |
Last > Previous Close
Last = Previous Close
Last < Previous Close |
| CE |
Green |
Last = Ceiling |
| FL |
Red |
Last = Floor |
| Open, High, Low |
Green
Yellow
Red |
Price > Previous Close
Price = Previous Close
Price < Previous Close |
 3Bid/3Offer 3Bid/3Offer
Displays 3 best bid and 3 best offer prices and volumes of a particular instrument. VMTrade presents data with the following color codes. Strength Bar Indicator illustrates Absolute Bid/Offer Volume and Value of such instrument.
| Field |
Description |
| Bid |
Bid price. Top 3 best bid price |
| B_Vol |
Bid volume. Top 3 best bid volume |
| Offer |
Offer price. Top 3 best offer price |
| O_Vol |
Offer volume. Top 3 best offer volume |
| Absolute Bid Volume |
Summation of best bid volume |
| Absolute Bid Value |
Summation of best bid value |
| Absolute Offer Value |
Summation of best offer value |
| Absolute Offer Volume |
Summation of best offer volume |
| Field |
Color |
Description |
| Bid/Offer price and volume |
Green |
Price > Previous Close |
| |
Yellow |
Price = Previous Close |
| |
Red |
Price < Previous Close |
Click on Bid/Offer price to go to Ticket menu with the selected price automatically filled.
Click on B_Vol/O_Vol to will go to Ticket menu with the selected price and quantity automatically filled.
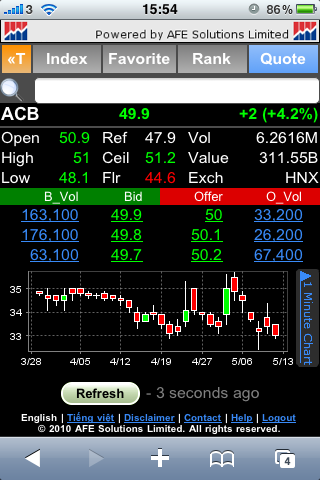
 Chart Chart
There are 2 chart modes: 1 Day Tick Chart and 30 Days Daily Chart.
1 Day Tick Chart - tick chart of current instrument.
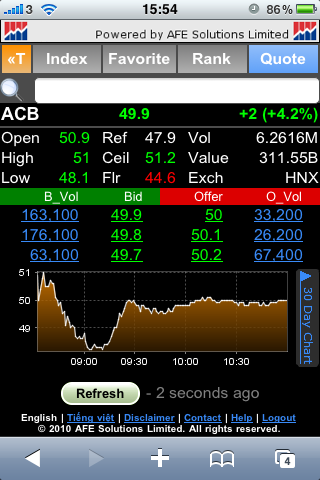
Click on 30 Days Daily Chart >> link to display 30 Days Daily Chart.
30 Days Daily Chart - 30 day candlestick daily chart of current instrument (include today data).
Click on 1 Day Tick Chart>> link to display 1 Day Tick Chart .
Back to top
|